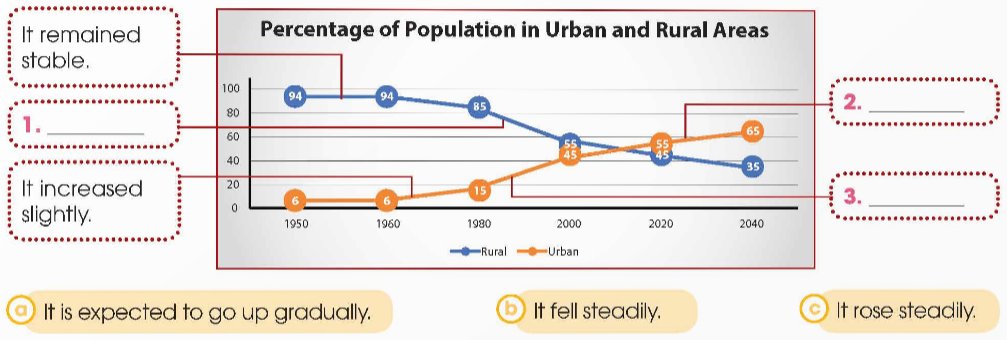
Work in pairs. Look at the line graph. Match the sentences with the information in the graph.

4. Look at the paragraph.Complete the parts in blue with your ideas. Then work in pairs. Ask questions ( a maximum of twenty) to find the information in your partner's paragraph. You can only answer " Yes, I did" or " No, I didn't".
(Nhìn vào đoạn văn. Hoàn thành các phần bằng màu xanh với ý tưởng của bạn. Sau đó làm việc theo cặp. Đặt câu hỏi (tối đa là hai mươi câu) để tìm thông tin trong đoạn văn của đối tác của bạn. Bạn chỉ có thể trả lời "Có, tôi đã làm" hoặc "Không, tôi đã không".)
Last week I went to (a famous city) and went to the cinema with (a famous actor/ actress). Then we had dinner with (a famous sports star) and we talked and danced for (two/ three/ four) hours.

Last week I went to Paris and went to the cinema with Angela Jolie. Then we had dinner with Lionel Messi and we talked and danced for four hours.
(Tuần trước, tôi đã đến Paris và đi xem phim với Angela Jolie. Sau đó, chúng tôi ăn tối với Lionel Messi và nói chuyện và khiêu vũ khoảng bốn giờ.)
A: Was Le Quy Don a Vietnamese scholar?
(Lê Quý Đôn có phải là nhà nho Việt Nam không?)
B: Yes, he was.
(Vâng, đúng rồi.)
A: Did he live in the 19th century.
(Có phải ông ấy sống ở thế kỷ 19 không.)
Student 2: No, he didn’t.
(Không, không phải.)
Student 1: Was he a poet, a scholar, and a government official?
(Ông ấy có phải là một nhà thơ, một học giả và một quan chức chính phủ không?)
Student 2: Yes, he was.
(Vâng, đúng rồi.)
Student 1: Did Le Quy Don go to China as an ambassador in 460?
(Lê Quý Đôn đi sứ sang Trung Quốc năm 460?)
Student 2: No, he didn’t.
(Không, không phải.)
Student 1: Was he the principal of the National University situated in the Văn Miếu in Hà Nội?
(Ông ấy có phải là hiệu trưởng trường Đại học Quốc gia ở Văn Miếu, Hà Nội không?)
Student 2: Yes, he was.
(Vâng, đúng rồi.)
Student 1: Did he have many works of the old Vietnamese literature?
(Ông có bao nhiêu tác phẩm thuộc văn học cổ Việt Nam?)
Student 2: Yes, he did.
(Vâng, đúng rồi.)
Student 1: Did he pass away in 1884 when he was 68 years old.
(Có phải ông ấy đã qua đời vào năm 1884 khi ông ấy 68 tuổi.)
Student 2: No, he didn’t.
(Không, không phải.)

Work in pairs. Match the ways to preserve our heritage with the reasons for doing so.
Ways | Reasons |
1. Learning about cultural heritage at school | a. Spreading information to more people quickly |
2. Promoting cultural heritage on social media | b. Helping students understand the value of cultural heritage |
3. Organising competitions to find good ideas for preserving our heritage | c. Making cultural heritage more widely known to people around the world |
4. Introducing cultural heritage to foreign visitors through tourism activities | d. Encouraging people to get more involved |
1 - b | 2 - a | 3 - d | 4 - c |
1 - b. Learning about cultural heritage at school: Helping students understand the value of cultural heritage
(Học về di sản văn hóa ở trường : Giúp học sinh hiểu được giá trị của di sản văn hóa)
2 - a. Promoting cultural heritage on social media: Spreading information to more people quickly
(Quảng bá di sản văn hóa trên mạng xã hội: Đưa thông tin đến nhiều người hơn một cách nhanh chóng)
3 - d. Organising competitions to find good ideas for preserving our heritage : Encouraging people to get more involved
(Tổ chức các cuộc thi tìm ý tưởng hay để bảo tồn di sản: Khuyến khích mọi người tham gia nhiều hơn)
4 - c. Introducing cultural heritage to foreign visitors through tourism activities: Making cultural heritage more widely known to people around the world
(Giới thiệu di sản văn hóa cho du khách nước ngoài thông qua hoạt động du lịch: Làm cho di sản văn hóa được mọi người trên thế giới biết đến rộng rãi hơn)
1. Work in pairs. Look at the photos of tourist attractions (A-G). Do you know which countries they are in? Match them with the countries in the box.
(Làm việc theo cặp. Nhìn vào các bức ảnh về các điểm du lịch (A–G). Bạn có biết chúng thuộc những quốc gia nào không? Nối chúng với các quốc gia trong hộp.)
1. England 2. France 3. Kenya 4. Peru 5. Turkey 6. the USA 7. Viet Nam
The graph shows the energy consumption by sector in Vietnam in 2006. Summarise the information by selecting and reporting the main features and make comparisons where relevant. You should write about 120 words.
5. USE IT! Work in pairs. Look at the pictures. Imagine that you went to a football match or basketball game last weekend. Prepare and practise new dialogues with the phrases in exercises 2 and 3.
(Làm việc theo cặp. Nhìn vào những bức tranh. Hãy tưởng tượng rằng bạn đã tham dự một trận đấu bóng đá hoặc trận đấu bóng rổ vào cuối tuần trước. Chuẩn bị và thực hành các đoạn hội thoại mới với các cụm từ trong bài tập 2 và 3.)

Peter: Hey, Linda. How are things?
Linda: Oh hi, Peter. Good, thanks. How was your weekend?
Peter: It was great, thanks. I went to a football match on Sunday.
Linda: Really? Is it good?
Peter: Yes, it was nice. There were a lot of goals. The Hoang Anh Gia Lai won 4-3 in the end.
Linda: That's good news! Who was you with?
Peter: My family. Would you like to come with my family next time?
Linda : Really, that's great. Text me when you re going, OK?
Peter: OK then. Bye, Linda. .
Linda: Bye.
Tạm dịch hội thoại:
Peter: Này, Linda. Mọi thứ thế nào?
Linda: Ồ, chào Peter. Mọi thứ ổn, cảm ơn bạn. Cuối tuần của bạn như thế nào?
Peter: Tuyệt vời, cảm ơn bạn. Tôi đã đi xem một trận đấu bóng đá vào Chủ nhật.
Linda: Vậy hả? Nó có hay không?
Peter: Vâng, nó rất hay. Có rất nhiều bàn thắng. Hoàng Anh Gia Lai thắng chung cuộc 4-3.
Linda: Đó là một tin tốt! Bạn đã đi với ai?
Peter: Gia đình tôi. Lần sau bạn có muốn đi cùng gia đình tôi không?
Linda: Tôi thực sự rất muốn, điều đó thật tuyệt với. Hãy nhắn cho tôi khi bạn đi nhé, được không?
Peter: Được rồi. Tạm biệt, Linda.
Linda: Tạm biệt.
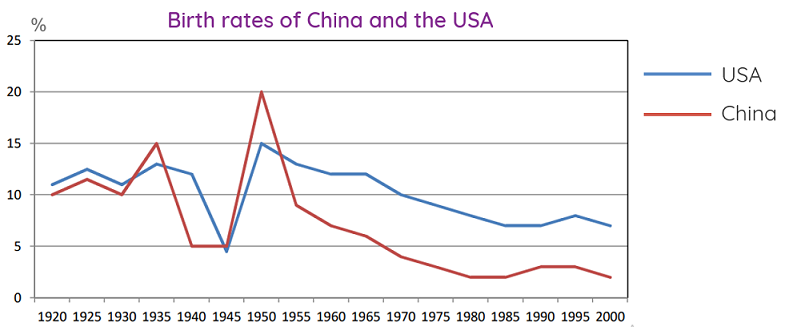
The graph below compares changes in the birth rates of China and the USA between 1920 and 2000.
Write a description (of about 150 words) of the trends in the graph.
Em viết phần intro nha:
The chart above decsribes how the birth rates of 2 countries namely China, USA changed in 80 years which started from 1920
Answer:
The line graph compares the birth rates in China and the US and how these rates changed from 1920 to 2000.
Overall, there was a general decline in fertility of both nations throughout the time surveyed. However, the US’s birth rates almost was higher than that of China over the whole period.
American saw a significant fluctuation in the birth rates between 1920 to 1935, but it always remained over 10%. However, in the following decade, the fertility of the US decreased sharply to under 5 %. From 1945 to 1950, there was a rapidly increased in American’s birth rates, at 15%, reaching the highest point of it’s own during the whole period. From that on, the fertility of the US fell gradually to 7% in 2000.
During the 80-year period, the birth rates in China changed more significantly than in the US. It fell down to 5% in the year 1940, then reaching a peak of whole line graph in 1950, at 20%. Over the remainder of the period, China saw a sharply drop in the birth rates to only about 2% until 2000.
The graph below compares the changes in the birth rates of China and the USA between 1920 and 2000.
Summarise the information by selecting and reporting the main features and make comparisons where relevant.
Write at least 150 words.
The graph demonstrated some striking similarities between the Chinese and the US birth rates from 1920 to 2000. Both countries experienced considerable fluctuations in the similar period with some lows during the 1940s and some highs during the 1930s.
The birth rates in China rose from 10% in 1920 to 15% in 1935. Later, the figure plunged to a low of 5% in the 1940s and was followed by an exponential growth to the peak of 20% in 1950. Next, the fertility rate dropped sharply to 8% in the following five years. Finally, the figure declined gradually to 3% during the latter half of the century.
Meanwhile, the US had similar birth rate of 12% to that of China in 1920. The figure fluctuated in between 12% and 14% during 1920s and 1930s until it hit a low of 4% in 1945. Five years later, the birth rate reached a peak at 15% in 1950 but it made a steady fall to the final figure of around 7% in 2000.
This report covers the requirements of the task. The main trends / features were sufficiently developed. The candidate has arranged ideas coherently, though the use of linking words can be improved. The range of vocabulary is adequate. There are a few errors in grammar and word choice, and one instance of inaccurate data. Overall, the task response meets the expectations and seems good enough to achieve Band 7.

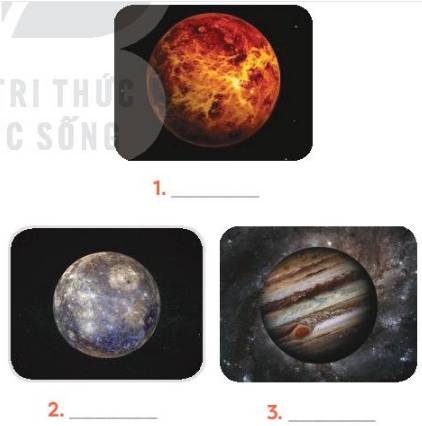
Work in pairs. Discuss and match the three planets in 3 with the pictures (1 - 3) below.

Exercise 2. ROCK, PAPER, SCISSORS. Work in pairs. Look at pictures 1-4 and play the game. The loser says two sentences about picture 4, one in the present continuous affirmative and one in the present continuous negative.
(KÉO BÚA BAO. Làm việc theo cặp. Nhìn vào hình 1-4 và chơi trò chơi. Người thua nói hai câu về hình ảnh 4, một câu ở hiện tại tiếp diễn khẳng định và một câu ở hiện tại tiếp diễn phủ định.)

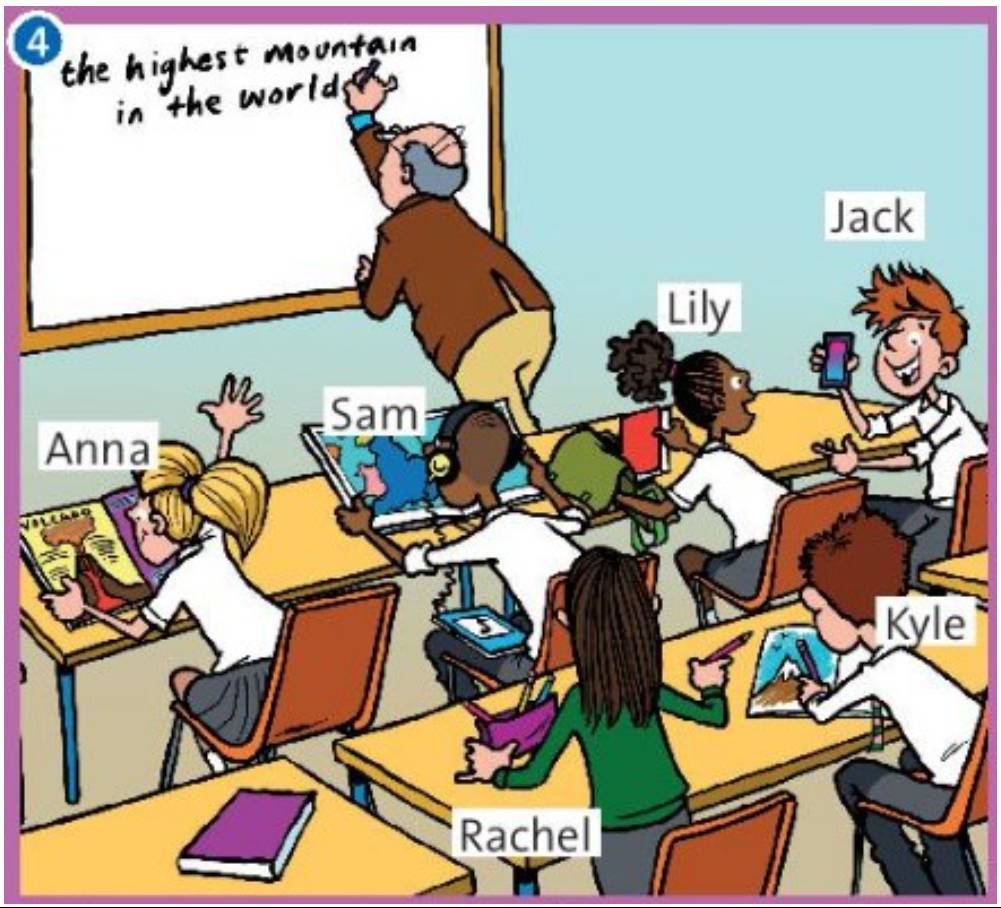
The teacher is writing on the board. (Thầy giáo đang viết lên bảng.)
Lily and Jack aren’t watching TV. (Lily và Jack không xem tivi.)
- Anna is reading a book. (Anna đang đọc sách.)
- Sam is wearing headphones. (Sam đang đeo tai nghe.)
- Lily is talking to Jack. (Lily đang trò chuyện với Jack.)
- Jack is holding a mobile phone. (Jack đang cầm điện thoại di động.)
- Rachel is giving Kyle a pen. (Rachel đang đưa cho Rachel cây bút.)
- Kyle is pointing at a picture. (Kyle đang chỉ vào bức tranh.)
- The teacher isn’t look at the students. (Thầy giáo không nhìn học sinh.)
- Anna and Sam aren’t drawing. (Anna và Sam không đang vẽ.)
- Rachel and Kyle aren’t listening to music. (Rachel và Kyle không đang nghe nhạc.)

Write at least 150 words.
You should spent 20 minutes on this task.
The line graph compares the fast food consumption of teenagers in Australia between 1975 and 2000, a period of 25
years.

Refer:
The line graph depicts a comparison between the consumption of three categories of fast food eaten by Australian teenagers over 25 year period from 1975 to 2000. In general, there was a gradual fall in consuming fish and chips while pizza and hambergers had an opposite trend.
As the graph shows, the amount of fish and chips peaked at 100 times per year in 1975. Then, there was a fluctuation during period from 1975 to 1985 before standing at about 95 times. Following this, the need for fish and chips significantly decreased to a low of nearly 40 times in 2000.
By contrast, pizza and hamburgers became more popular and their expenditure substantially went up. Looking at the details, pizza’s consumption rised steadily from about 2 times in 1975 to over 80 times in 1995, though its figure leveled off from 1995 to 2000. Likewise, there was a considerable increase of hamburgers’ rate from 5 times to approximately 83 times. This rise was noticeable between 1975 and 1985 but the growth slowed during the remaining period.