Work in pairs. Look at the line graph. Match the sentences with the information in the graph.
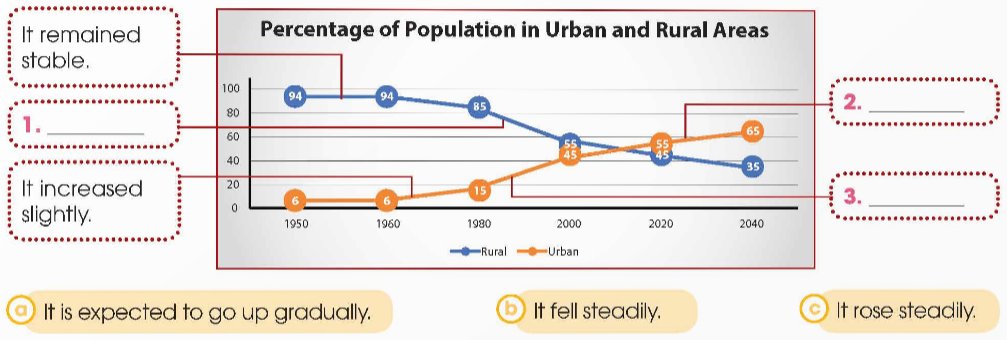
Work in pairs. Look at the line graph. Match the sentences with the information in the graph.
Look at the line graph and put the paragraphs in the correct order.
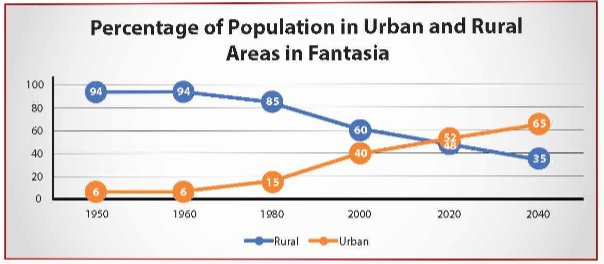
A. By contrast, the urban population rose throughout the same period. In 1950, the percentage of urban population was just around 6 per cent. It increased slightly to 15 per cent in 1980. After that, the figure rose steadily and in 2000 it stood at 40 per cent. The upward trend continued and in 2020, more than half of its population lived in urban areas. In the next twenty years, the urban population is expected to reach 65 per cent of the total population.
B. The line graph shows population trends in Fantasia's urban and rural areas over the 1950-2040 period. Overall, the urban population has increased and will continue to grow while the rural population has decreased and will continue to fall.
C. In 1950, 94 per cent or most of Fantasia's population lived in rural areas. This figure remained stable until 1960. However, from 1960 to 1980, the percentage of rural population fell slightly to 85 per cent. This figure went down steadily to 48 per cent in 2020 and is expected to drop to 35 per cent in 2040.
Thảo luận (1)Hướng dẫn giảiĐáp án: B - C - A
Hướng dẫn dịch:
A. Ngược lại, dân số thành thị lại tăng trong cùng thời kỳ. Năm 1950, tỷ lệ dân số thành thị chỉ khoảng 6%. Nó tăng nhẹ lên 15% vào năm 1980. Sau đó, con số này tăng đều đặn và đến năm 2000 đứng ở mức 40%. Xu hướng tăng tiếp tục diễn ra và đến năm 2020, hơn một nửa dân số sống ở khu vực thành thị. Trong 20 năm tới, dân số thành thị dự kiến sẽ đạt tới % trong tổng dân số.
B. Biểu đồ đường thể hiện xu hướng dân số ở khu vực thành thị và nông thôn Fantasia trong giai đoạn 1950-2040. Nhìn chung, dân số thành thị đã tăng và sẽ tiếp tục tăng trong khi dân số nông thôn đã giảm và sẽ tiếp tục giảm.
C. Năm 1950, 94% hay phần lớn dân số Fantasia sống ở khu vực nông thôn. Con số này duy trì ổn định cho đến năm 1960. Tuy nhiên, từ năm 1960 đến năm 1980, tỷ lệ dân số nông thôn giảm nhẹ xuống còn 85%. Con số này giảm dần xuống còn 48% vào năm 2020 và dự kiến sẽ giảm xuống 35% vào năm 2040.
(Trả lời bởi Nguyễn Quốc Đạt)
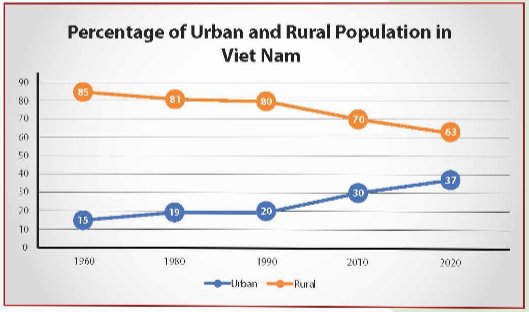
The line graph below illustrates population trends in Viet Nam from 1960 to 2020. Write a description (120-150 words) of the graph. Use the expressions in 1, the model and tips in 2, and the suggestions below to help you.
The line graph shows population trends in Viet Nam from 1960 to 2020. Overall, the urban population ...
In 1960, most Vietnamese people...
However, from 1960 to 1980, ... From 1990, ...
By contrast, the urban population rose throughout the same period. In 1960, ...
In 1980,... From 1990, ...
Thảo luận (1)Hướng dẫn giảiThe line graph shows the urban and rural population in Viet Nam from 1960 to 2020. Overall, the urban population increased while the rural population decreased.
In 1960, most Vietnamese people lived in rural areas. However, from 1960 to 1980, the percentage of the rural population fell slightly to 81 per cent. Then the figure remained stable for the next ten years. From 1990 to 2000, the proportion of the population living in rural areas continued to decrease gradually. In 2020, the rural population was only 63 per cent of the total population of Viet Nam.
By contrast, the urban population rose throughout the same period. In 1960, the percentage of the city population was just around 15 per cent. The figure went up slightly in 1980 and remained stable until 1990 when less than 20 per cent of the population lived in urban areas. Since 1990, the proportion of the urban population has increased gradually and in 2020, it reached 37 per cent of the total population.
Hướng dẫn dịch:
Biểu đồ đường thể hiện dân số thành thị và nông thôn ở Việt Nam từ năm 1960 đến năm 2020. Nhìn chung, dân số thành thị tăng trong khi dân số nông thôn giảm.
Năm 1960, hầu hết người dân Việt Nam sống ở nông thôn. Tuy nhiên, từ năm 1960 đến năm 1980, tỷ lệ dân số nông thôn giảm nhẹ xuống còn 81%. Sau đó, con số này vẫn ổn định trong mười năm tiếp theo. Từ năm 1990 đến năm 2000, tỷ trọng dân số sống ở nông thôn tiếp tục giảm dần. Năm 2020, dân số nông thôn chỉ chiếm 63% tổng dân số Việt Nam.
Ngược lại, dân số thành thị lại tăng trong cùng thời kỳ. Năm 1960, tỷ lệ dân số thành phố chỉ khoảng 15%. Con số này tăng nhẹ vào năm 1980 và duy trì ổn định cho đến năm 1990 khi chưa đến 20% dân số sống ở khu vực thành thị. Từ năm 1990, tỷ lệ dân số thành thị tăng dần và đến năm 2020 đạt 37% tổng dân số.
(Trả lời bởi Nguyễn Quốc Đạt)