Chọn đáp án B
Sử dụng biểu đồ kết hợp cột và đường. Có thể dùng cột thể hiện số dân hoặc sản lượng lúa cũng được, tốt nhất là sử dụng cho số dân.
Chọn đáp án B
Sử dụng biểu đồ kết hợp cột và đường. Có thể dùng cột thể hiện số dân hoặc sản lượng lúa cũng được, tốt nhất là sử dụng cho số dân.
Cho bảng số liệu
Dân số và sản lượng lúa của Việt Nam trong thời kì 1981 – 2004

Để thể hiện dân số và sản lượng lúa trong thời kì 1981 -2000, biểu đồ thích hợp nhất là
A. biểu đồ kết hợp
B. biểu đồ đường biểu diễn
C. biểu đồ hình cột
D. biểu đồ miền
Cho bảng số liệu
Dân số và sản lượng lúa của Việt Nam trong thời kì 1981 – 2004
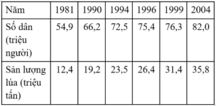
Để thể hiện dân số và sản lượng lúa trong thời kì 1981 -2000, biểu đồ thích hợp nhất là
A. biểu đồ hình cột
B. biểu đồ kết hợp
C. biểu đồ đường biểu diễn
D. biểu đồ miền
Cho bảng số liệu
Dân số và sản lượng lúa của Việt Nam trong thời kì 1981 – 2004
| Năm |
1981 |
1990 |
1994 |
1996 |
1999 |
2004 |
| Số dân(triệu người) |
54,9 |
66,2 |
72,5 |
75,4 |
76,3 |
82,0 |
| Sản lượng lúa (triệu tấn) |
12,4 |
19,2 |
23,5 |
26,4 |
31,4 |
35,8 |
Để thể hiện dân số và sản lượng lúa trong thời kì 1981 -2000, biểu đồ thích hợp nhất là:
A. biểu đồ kết hợp.
B. biểu đồ đường biểu diễn.
C. biểu đồ hình cột.
D. biểu đồ miền.
Cho bảng số liệu dưới đây:
DIỆN TÍCH VÀ SẢN LƯỢNG LÚA CỦA CẢ NƯỚC TỪ NĂM 1990 ĐẾN NĂM 2015
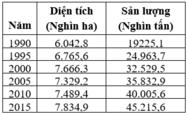
(Nguồn Tổng cục Thống kê Việt Nam)
Để vẽ biểu đồ thể hiện diện tích và sản lượng lúa nước ta từ năm 1990 đến 2015, biểu đồ nào sau đây thích hợp nhất?
A. Biểu đồ tròn.
B. Biểu đồ miền
C. Biểu đồ kết hợp cột và đường
D. Biểu đồ đường
Cho bảng số liệu dưới đây:
DIỆN TÍCH VÀ SẢN LƯỢNG LÚA CỦA CẢ NƯỚC TỪ NĂM 1990 ĐẾN NĂM 2015
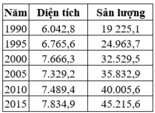
Để vẽ biểu đồ thể hiện diện tích và sản lượng lúa nước ta từ năm 1990 đến 2015, biểu đồ nào sau đây thích hợp nhất?
A. Biểu đồ tròn
B. Biểu đồ miền
C. Biểu đồ kết hợp cột và đường
D. Biểu đồ đường
Cho bảng số liệu dưới đây:
DIỆN TÍCH VÀ SẢN LƯỢNG LÚA CỦA CẢ NƯỚC TỪ NĂM 1990 ĐẾN NĂM 2015
| Năm |
Diện tích (Nghìn ha) |
Sản lượng (Nghìn tấn) |
| 1990 |
6.042,8 |
19225,1 |
| 1995 |
6.765,6 |
24.963,7 |
| 2000 |
7.666,3 |
32.529,5 |
| 2005 |
7.329,2 |
35.832,9 |
| 2010 |
7.489,4 |
40.005,6 |
| 2015 |
7.834,9 |
45.215,6 |
(Nguồn Tổng cục Thống kê Việt Nam)
Để vẽ biểu đồ thể hiện diện tích và sản lượng lúa nước ta từ năm 1990 đến 2015, biểu đồ nào sau đây thích hợp nhất?
A. Biểu đồ tròn.
B. Biểu đồ miền.
C. Biểu đồ kết hợp cột và đường.
D. Biểu đồ đường.
Cho bảng số liệu dưới đây:
DIỆN TÍCH VÀ SẢN LƯỢNG LÚA CỦA CẢ NƯỚC TỪ NĂM 1990 ĐẾN NĂM 2015
(Nguồn: Tổng cục Thống kê Việt Nam)
| Năm |
Diện tích (Nghìn ha) |
Sản lượng (Nghìn tấn) |
| 1990 |
6.042,8 |
19 225,1 |
| 1995 |
6.765,6 |
24.963,7 |
| 2000 |
7.666,3 |
32.529,5 |
| 2005 |
7.329,2 |
35.832,9 |
| 2010 |
7.489,4 |
40.005,6 |
| 2015 |
7.834,9 |
45.215,6 |
Để vẽ biểu đồ thể hiện diện tích và sản lượng lúa nước ta từ năm 1990 đến 2015, biểu đồ nào sau đây thích hợp nhất?
A. Biểu đồ tròn.
B. Biểu đồ miền
C. Biểu đồ kết hợp cột và đường.
D. Biểu đồ đường.
Cho bảng số liệu sau.
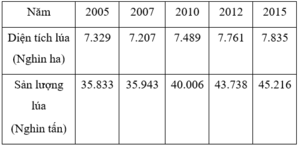
(Nguồn: Niên giám Thống kê Việt Nam 2015)
Để thể hiện diện tích và sản lượng lúa từ năm 2005 đến năm 2015, biểu đồ thích hợp là
A. biểu đồ tròn.
B. biểu đồ đường
C. biểu đồ cột nhóm
D. biểu đồ miền
Cho bảng số liệu: Tình hình sản xuất lúa nước ta thời kì 1999 – 2010.
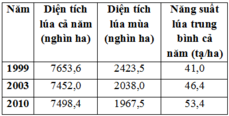
Dựa vào bảng số liệu trên em hãy cho biết để thể hiện tình hình sản xuất lúa nước ta thời kì 1999 – 2010 ta nên chọn dạng biểu đồ nào thể hiện tốt nhất:
A. Biểu đồ đường.
B. Biểu đồ hình cột.
C. Biểu đồ hình tròn.
D. Biểu đồ kết hợp.